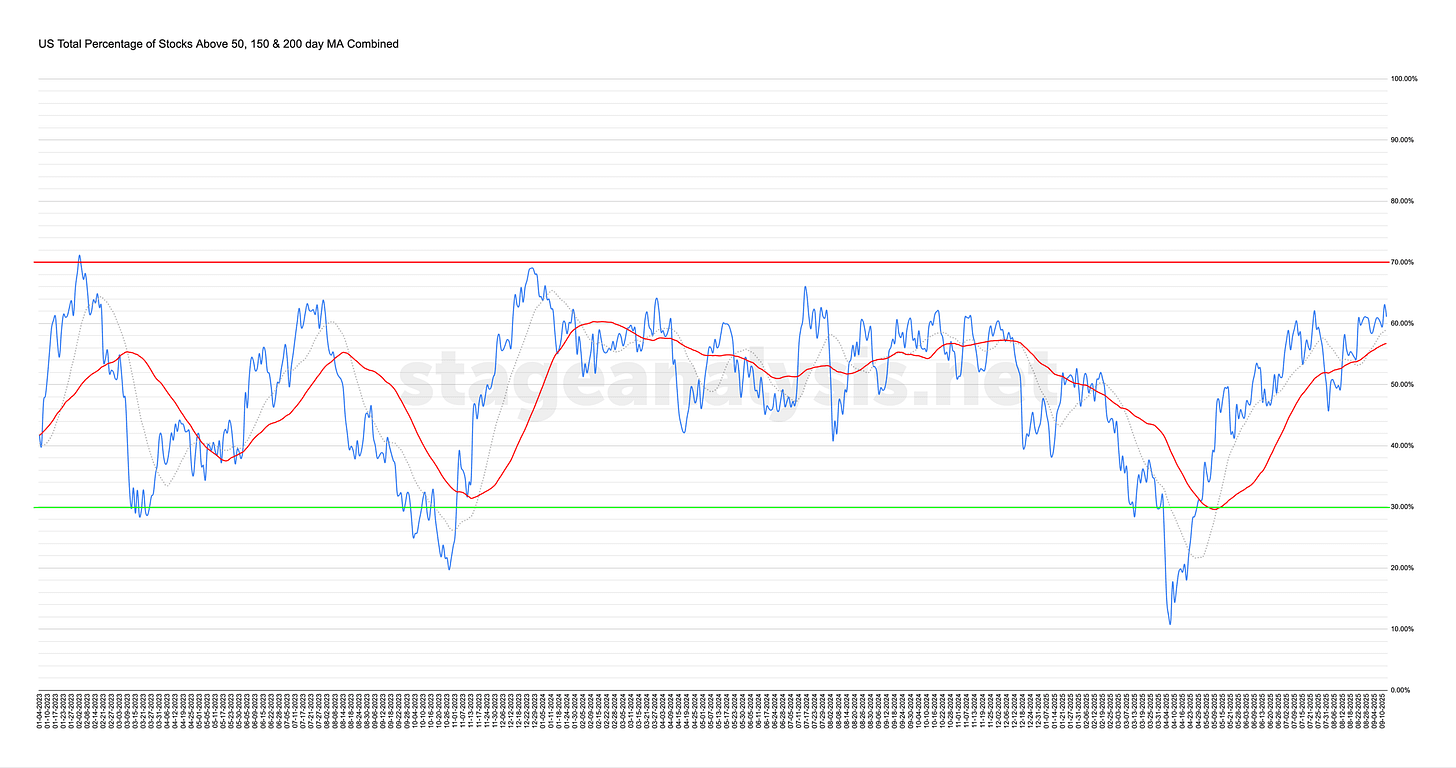
Market Breadth: Moving Averages
➜ Members: login to the website to view the full post: Market Breadth: Percentage of Stocks Above their 50 Day, 150 Day & 200 Day Moving Averages Combined
61.09% (+0.23% 1wk)
Status: Positive Environment
The US Total Percentage of Stocks above their 50 Day, 150 Day & 200 Day Moving Averages (shown above) increased by +0.23% this week.
Therefore, the overall combined average is at 61.09% in the US market (NYSE and Nasdaq markets combined) above their short, medium and long term moving averages.
The combined average continued to consolidate this week, with a brief spike on Thursday before pulling back again on Friday, and is +2.09% above the short-term 20 day MA and +4.38% above its 50 day MA (signal line). Therefore, the status continues to hold on a Positive Environment status to start the new week.
Stage Analysis Members - Save up to 20% with Quarterly and Annual Billing
*We are not licensed to give investment advice. All content provided in this email is for educational purposes only and should not be construed as investment advice. You should not invest in any stock based solely on the information provided. Trading stocks is highly speculative and involves a high degree of risk of loss. You could lose some or all of your money. You should conduct your own independent research and due diligence to verify any information provided.

